 .
.
This is a tutorial on solving inequalities with two variables. Several examples and problems with solutions and detailed explanations are presented.
We first clarify what is a solution of an inequality in two variables x and y?
An ordered pair (a , b) is a solution to a given inequality in two variables x and y if the inequality is true when x and y are substituted by a and b respectively. Since the ordered pair can be represented by a point, in general, the solution set (all solutions) of the inequality is a set of point that form a region in the x-y plane.
If we replace the inequality symbol in an inequality in two variables by an equal sign, we obtain the corresponding equation to the given inequality. The graph of the corresponding equation splits the plane into regions such that: either all points in a given region are solutions to the inequality of none of the points in that region are solutions to the inequality. We shall clarify all the above through examples with detailed explanations.
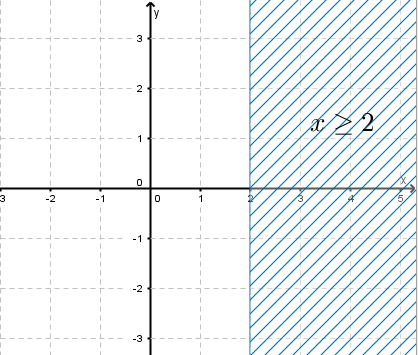
Example 1: Solve graphically the inequality x?2
Solution to Example 1:
Three steps to find the solution set the the given inequality.
1) Graph the corresponding equation x=2; this will split the plane into two regions. One of the region represents the solution set.
2) Select a point situated in any of the two regions obtained and test the inequality. If the point selected is a solution, then all the region is the solution set. If the selected point is not a solution, then the other (second) region represents the solution set.
3) Test: In this example, let us for example select the point with coordinates (3 , 2) which is in the region to the right of the line x = 2. If you substitute x in the inequality x?2 by 3 it becomes 3?2 which is a true statement and therefore (3 , 2) is a solution.
Hence, we can conclude that the region to the right of the vertical line x = 2 is a solution set including the line itself which is shown as a solid line because of the inequality symbol ? contains the = symbol. The solution set is represented by the blue hash region in the graph below including the line x = 2.
.
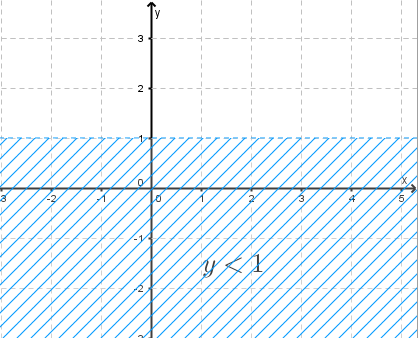
Example 2: Solve graphically the inequality y<1
Solution to Example 2:
Three steps to find the solution set the the given inequality.
1) Graph the corresponding equation y=1. It is a horizontal line that splits the plane into two regions.
2) Select point (1,−1) situated in the region below the horizontal line.
3) Test the point (1,−1) in the inequality by substituting y by -1 in the inequality to solve: -1 < 1 is a true statement.
The solution set is the region below the graph of y=−1, the region shown in blue below. Because the inequality symbol is strictly < (does not include the = such as ?), the graph of the line y = 1 is broken.
 .
.
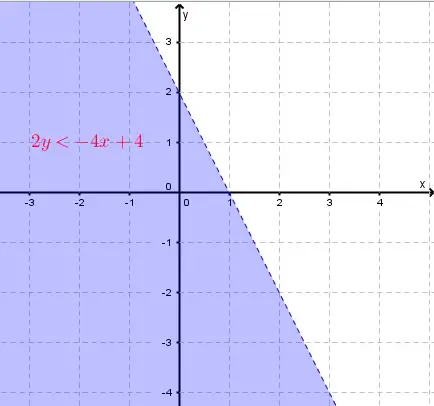
Example 3: Solve graphically the inequality
Solution to Example 3:
Three steps to find the solution set the the given inequality.
1) Graph the equation 2y=−4x+4. It is a line with x intercept at (1 , 0) and y intercept at (0 , 2).
2) Select point (0,0) situated in one of the regions made by the graph in step 1.
3) Test the point (0,0) in the inequality by substituting x by 0 and y by 0 in the inequality to solve:
2(0)<−4(0)+4
Simplify the above
0<4 : it is a true statement
The solution set is the region containing point (0 , 0) ; the purple region shown below. Because the inequality is "strictly less than" ( as opposed to "less than or equal"), the line is broken.
 .
.
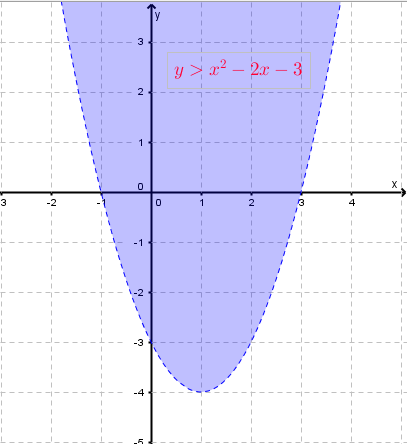
Example 4: Solve graphically the inequality
Solution to Example 4:
1) Graph the equation y=x2−2x−3. It is a parabola with 2 x-intercepts: at (-1 , 0) and (3 , 0) and a y-intercept at (0 , -3).
2) Select point (0,0) situated in one of the regions made by the graph in step 1.
3) Test the point (0,0) in the inequality by substituting x by 0 and y by 0 in the inequality to solve:
0>(0)2−2(0)−3
Simplify
0>−3 : it is a true statement
The solution set is the region containing point (0 , 0) ; the purple region shown below. Because the inequality is "strictly greater than" ( as opposed to "greater than or equal"), the graphs is broken.
 .
.